Where FMCG distribution is workable in Syria: regions and channels, from public data
Short answer: public data does not rank Syria’s regions for FMCG distribution, but it does show that operating conditions differ widely. In May 2026 the share of surveyed shops reporting an operating barrier ranged from 12% in Damascus to 89% in As-Sweida, and the most common barrier nationally was high supplier prices, not roads or security. On retail channels, almost nothing is measured publicly. FMCG means fast-moving consumer goods: food, drink, household and personal-care products. Information checked on 19 November 2026; sources are at the end.
We are describing operating conditions as public sources report them. We do not say which governorates any company covers. Al Takaful reaches eight of Syria’s fourteen governorates, and nothing below should be read as a statement about which ones.
Key facts
- Barriers: 57% of surveyed shops reported at least one operating barrier in May 2026, up from 47% in February; the top barrier was high supplier prices limiting restocking, at 47% (REACH, May 2026).
- Access and security: only 7% of shops reported physical-access barriers for customers and 6% security barriers (REACH, May 2026).
- Range by governorate: 12% of shops in Damascus and 29% in Rural Damascus, against 80% in Al-Hasakeh, 86% in Quneitra and 89% in As-Sweida (REACH, May 2026).
- Payments: 94% of shops accepted Syrian pounds and 47% accepted US dollars (REACH, May 2026).
- North-east stock cover: two to three days for fuel and fresh vegetables in the areas assessed in January 2026, with 40 to 46% of shops relying on one supplier (REACH, January 2026).
- Goods movement: most parts of Syria had no major access disruptions (Logistics Cluster, 9 July 2026).
What does the main public market survey measure?
REACH’s Joint Market Monitoring Initiative surveyed 4,761 shops in 230 communities across all 14 governorates between 4 and 11 May 2026. It asks shopkeepers about prices, stock, suppliers and obstacles to trading, mainly for essential goods. That makes it a good indicator of how markets function, and a limited guide to branded FMCG specifically.
Its national finding is more about cost than about access. Some 57% of shops reported at least one operating barrier, up from 47% in February 2026. The most common barrier, at 47%, was high prices from suppliers limiting restocking, followed by lack of funds at 23%. Only 7% of shops reported physical-access barriers affecting their customers and 6% reported security barriers, down from 13% in February.
How do operating conditions differ by governorate?
The share of shops reporting an operating barrier ranged widely in May 2026, as the chart shows.
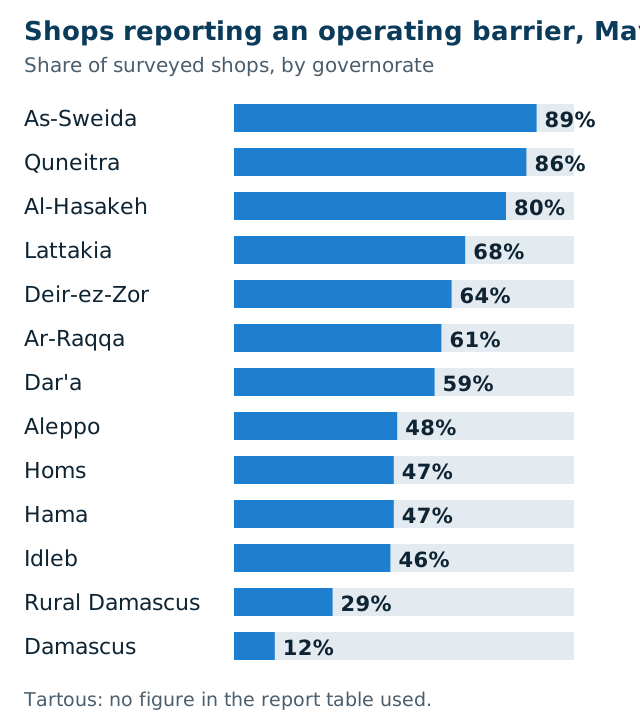
Source: REACH / IMPACT, Joint Market Monitoring Initiative, Syria, May 2026 (accessed 19 November 2026). Share of surveyed shops reporting at least one operating barrier. Tartous has no figure in the table we used. Governorate-level samples are smaller than the national sample, so treat gaps of a few points as noise.
Three readings are fair. Damascus and Rural Damascus had the lowest shares. A group of governorates in the middle, including Aleppo, Homs, Hama and Idleb, sat at 46 to 48%. And the highest shares were in As-Sweida, Quneitra and Al-Hasakeh. A high share does not say why. Nationally the top barrier was supplier prices, not roads or security, so the chart is a measure of trading difficulty, not of access alone.
The same survey shows how much the cost of goods differs across regions. The table gives its median cost of the food portion of a basic basket in May 2026.
| Governorate | Median food basket, million Syrian pounds |
|---|---|
| Idleb | 1.29 |
| Aleppo | 1.31 |
| Hama | 1.48 |
| Lattakia | 1.48 |
| Homs | 1.49 |
| Deir-ez-Zor | 1.55 |
| Tartous | 1.56 |
| Al-Hasakeh | 1.56 |
| Ar-Raqqa | 1.61 |
| Quneitra | 1.64 |
| Damascus | 1.66 |
| Dar’a | 1.66 |
| Rural Damascus | 1.77 |
| As-Sweida | 1.93 |
Source: REACH / IMPACT, May 2026, in pre-redenomination units. The basket is a humanitarian measure, not a retail-sales one. The spread, from 1.29 million in Idleb to 1.93 million in As-Sweida, is still a useful proxy for the different supply costs a distributor meets.
What do assessments say about the north-east and east?
REACH ran rapid assessments in the north-east in 2026. In January it found markets in Ar-Raqqa largely functional, with localised stress in Al-Hasakeh and Ain Al Arab during a mid-month escalation. Shops in the areas it examined held two to three days of stock of fuel and fresh vegetables, and 40 to 46% relied on a single supplier. REACH adds that administrative boundaries do not always match lines of control, so access is shaped by who controls a given area.
In April, after floods in Al-Hasakeh and Deir-ez-Zor, it found markets mostly functioning, with more than 70% of vendors reporting full availability across categories and diesel prices up by about 31 to 42%.
On goods movement, the Logistics Cluster’s July 2026 minutes say most parts of Syria had no major access disruptions, with localised delays. They also say transshipments to Al-Hasakeh, Ar-Raqqa and Deir-ez-Zor still needed Foreign Ministry clearance, taking about two days, longer in busy periods. That statement is made about aid shipments; we found no commercial-cargo rule.
Which retail channels exist, and what is measured?
The honest answer on channels is that public data barely exists.
- Traditional shops. A Catalan trade-agency profile describes small retailers as dominant and modern retail as limited, with no reliable data on chains or market shares. The page rests on older information.
- Wholesale. REACH treats the sub-district as the smallest meaningful market unit, covering retailers, wholesalers and transport links, and identified Maabada as a key local wholesale hub in earlier work. We found no wider map of wholesale markets.
- Payments and credit. The May 2026 survey found 94% of shops accepting Syrian pounds and 47% accepting dollars, and fewer shops giving credit. The National reported in August 2026 that much of the economy remains cash-based, with card networks only beginning to return.
- E-commerce. We found no opened source on online delivery of physical goods.
What does public data leave out?
For a distributor’s planning, the gaps matter as much as the findings. We could not open a source on road conditions or checkpoint costs by corridor, transport cost per kilometre, electricity supply by governorate, population by governorate, regional investment, or the shares of different channels. Search results referred to several of these topics, but the pages could not be opened and we have not used them.
How can a planner use this?
- Use the survey as a starting filter, not a verdict. Treat a high barrier share as a reason to ask what is driving it, then ask partners directly.
- Ask for supplier and stock data from the partner’s own outlets. The public record cannot answer how many days of stock a given region holds for your category.
- Plan for price dispersion. Regional differences in basket cost mean one price list will not fit every region.
- Plan for payment mix. Cash, pounds and dollars all appear, so credit and settlement terms need to be explicit.
- Check the position again every quarter. The barrier share moved by 10 points in either direction in a single quarter in several governorates.
Frequently asked questions
Which Syrian governorates are easiest to distribute to? No public source ranks them for distribution. REACH’s May 2026 survey found the lowest shares of shops reporting an operating barrier in Damascus (12%) and Rural Damascus (29%), but the survey covers essential goods, not branded FMCG.
What is the biggest obstacle shops report? High prices from suppliers limiting restocking: 47% of shops in May 2026 (REACH).
Are roads and security the main barrier? Not according to shops. Only 7% reported physical-access barriers and 6% security barriers in May 2026 (REACH).
How much data exists on retail channels? Very little. We found no public source splitting sales between traditional shops, wholesalers, modern trade and online.
Sources
All accessed 19 November 2026.
- REACH / IMPACT, Joint Market Monitoring Initiative, Syria, May 2026: repository.impact-initiatives.org
- REACH, Rapid Market Assessment, Aleppo (Ain Al Arab), Al-Hasakeh and Ar-Raqqa, January 2026: repository.impact-initiatives.org
- REACH, Rapid Market Assessment, north-east Syria floods, April 2026: repository.impact-initiatives.org
- Logistics Cluster, Syria coordination meeting minutes, 9 July 2026: logcluster.org
- ACCIO (Catalonia Trade and Investment), Syria: distribution: tradeportal.accio.gencat.cat
- The National, “Dubai’s e-commerce playbook aims to boost Syrian market”, 26 August 2026: thenationalnews.com